Flow cytometry is a powerful and versatile technology widely used in cell analysis, allowing for the rapid quantification and sorting of cells within a heterogeneous population. This technique leverages the principles of fluid dynamics and laser optics to provide detailed information about the physical and chemical properties of individual cells.
Principles of Flow Cytometry:
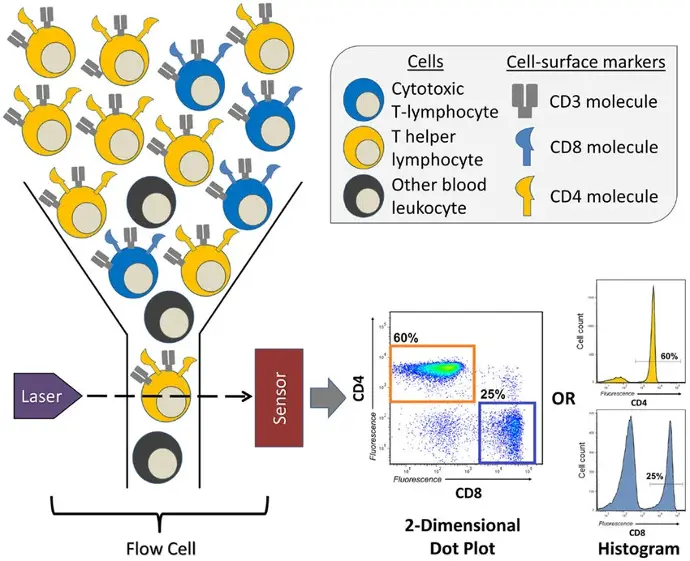
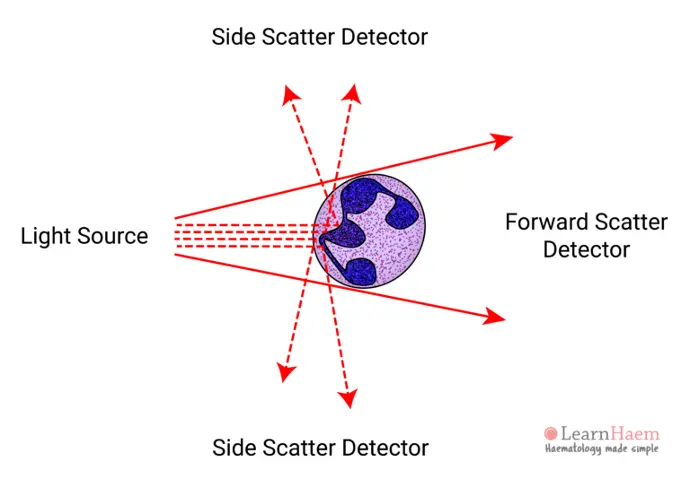
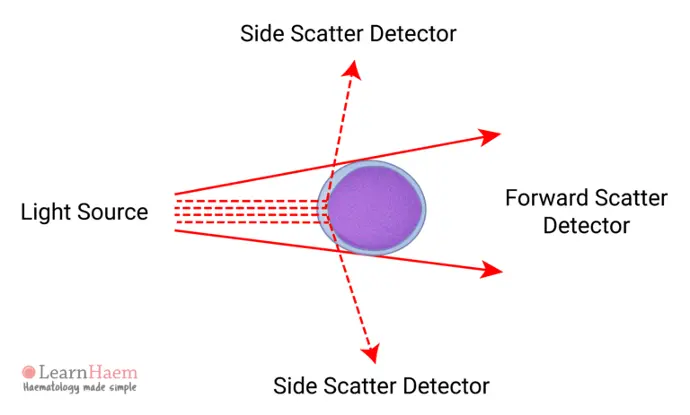
At its core, flow cytometry operates by suspending cells in a stream of fluid and passing them through a laser beam. As each cell passes through the laser, it scatters light and may emit fluorescence if labeled with specific dyes or antibodies. The scattered light and fluorescence signals are collected by detectors, which convert these signals into electronic data that can be analyzed by specialized software.
There are several key parameters measured by flow cytometry:=
- Forward Scatter (FSC): Correlates with cell size.
- Side Scatter (SSC): Relates to cell granularity or internal complexity.
- Fluorescence: Provides information about specific cellular components or functions, depending on the fluorochromes used.
Applications in Cell Biology:
Flow cytometry is employed across various fields within cell biology due to its ability to provide rapid and quantitative multi-parametric analysis. Some notable applications include:
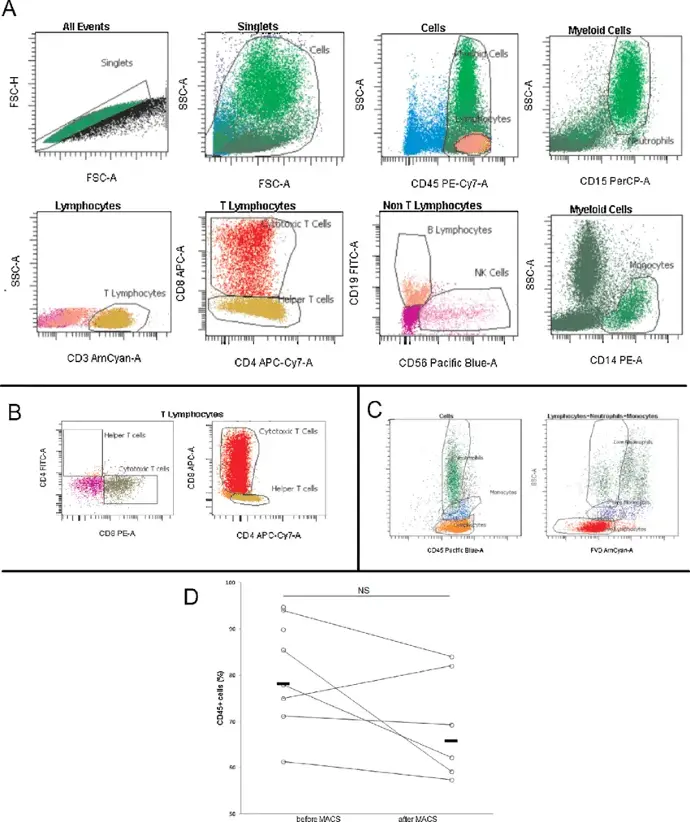
Immunophenotyping:This application involves the identification and quantification of specific cell types within a mixed population based on the expression of surface or intracellular markers. It is particularly useful in immunology for characterizing immune cell subsets, such as T cells, B cells, and monocytes.
Cell Cycle Analysis: By using DNA-binding dyes, flow cytometry can assess the DNA content of cells, allowing researchers to determine the distribution of cells across different phases of the cell cycle. This is crucial for studies on cell proliferation and the effects of various treatments on cell division.
Apoptosis Detection: Flow cytometry can detect early apoptotic events through markers like annexin V binding to phosphatidylserine exposed on the outer leaflet of the plasma membrane, or by measuring mitochondrial membrane potential changes and caspase activation.
Functional Assays: These assays include measuring intracellular calcium levels, pH, and reactive oxygen species (ROS) production. By using fluorescent indicators sensitive to these parameters, researchers can study cell signaling pathways and metabolic states in real-time.
Advances and Innovations:
Recent advancements in flow cytometry have significantly enhanced its capabilities:
Multiparametric Analysis: Modern flow cytometers can analyze multiple fluorescence parameters simultaneously, thanks to the development of new fluorochromes and improved optical systems. This allows for a more comprehensive analysis of cell populations.
High-throughput Screening: Integration with automated sample handling systems enables high-throughput screening, making flow cytometry a valuable tool in drug discovery and large-scale phenotypic screens.
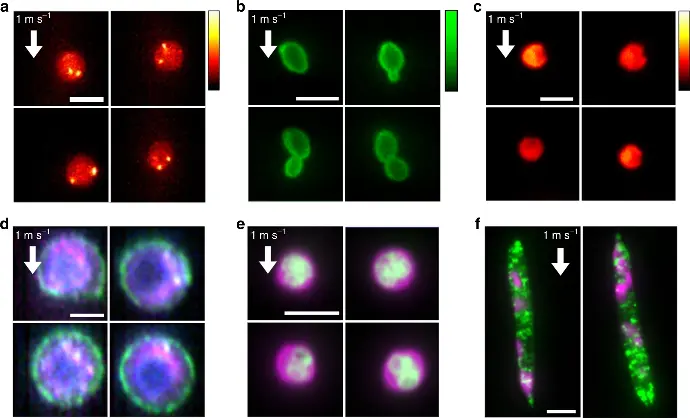
Image Cytometry: Combining flow cytometry with imaging techniques, known as imaging flow cytometry, provides detailed morphological information along with traditional fluorescence data. This hybrid approach offers insights into cell structure and function with higher resolution.
Mass Cytometry: By using metal isotope-labeled antibodies instead of traditional fluorochromes, mass cytometry (CyTOF) can measure over 40 parameters simultaneously with minimal spectral overlap, providing unprecedented depth in cell phenotyping.
Conclusion:
Flow cytometry remains an indispensable tool in cell analysis, offering rapid, quantitative, and multiparametric insights into cellular properties. Its applications span immunology, oncology, hematology, and beyond, facilitating both basic research and clinical diagnostics. Continued advancements in flow cytometry technology promise to further expand its capabilities, making it even more integral to the study of cell biology and the development of new therapeutic strategies.
